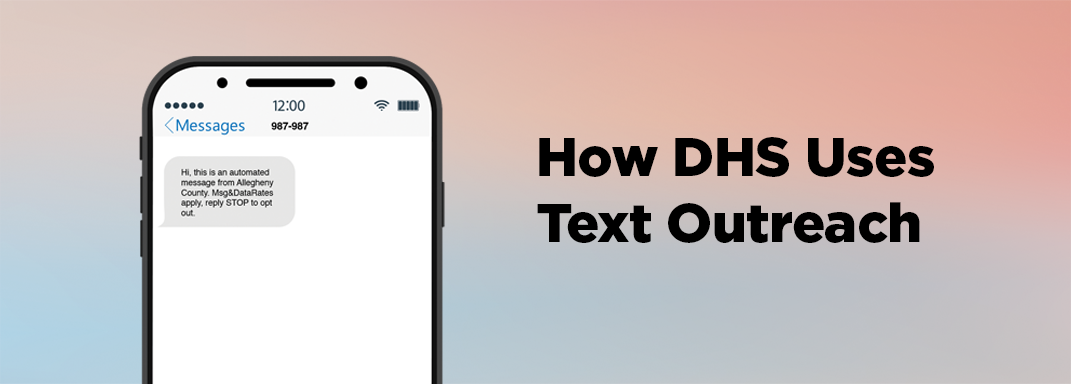
Current Information

Allegheny County DHS sends text messages to county residents for a variety of reasons, including increasing awareness of services, providing timely reminders, and gathering feedback after a service experience.  In addition, DHS uses this information to help evaluate and monitor programs it delivers.  This dashboard displays information about these outreach and engagement efforts, including the subject and purpose of these and the rates of engagement.  Data on DHS’s texting efforts are available from November 2017 to the present.

The dashboard allows users to examine DHS text messaging as a whole as well as drill down to individual text campaigns.  It allows users to understand the purpose of each campaign, the number of messages sent and the demographics of the people being contacted by each campaign.  DHS collects this information through Community Connect Labs (CCL), DHS’s texting software, and information is updated daily. Click here for a more detailed report on DHS’s texting outreach from 2018-2022.

Access the report

The Intimate Partner Violence Reform Initiative was created in May 2022 to coordinate policy and system-level work across agencies in Allegheny County to improve a complex and fragmented system for both survivors of intimate partner violence (IPV) and those who use violence.

Stakeholders from local and federal criminal justice systems, victim service organizations, community groups, healthcare and human services are working to improve the ways in which people can access help, how our systems work together and share information, and how we can prevent the most serious harm. This report outlines the progress made in the first year of the initiative, as well as plans and priorities to continue these reform efforts.

Current Information

In May 2022, Allegheny County assembled a taskforce of leaders to reduce intimate partner violence (IPV) through improved coordination, information sharing, training, and implementation of interventions that target both those who use violence and those who are victims or survivors of it.

Historically, the County’s understanding of IPV has been based on national data, which, though useful, fails to capture local nuances that lend greater insight into specific community needs. The objective of this report is to provide more local context to problems of IPV in Allegheny County by describing trends in demographics, human services involvement, and criminal histories among victims and perpetrators of intimate partner homicides (IPH) from January 2017 through September 2022. Importantly, the findings presented here point to a disproportionate impact on individuals who are disadvantaged not only by their gender identity, but also by systemic racial and socioeconomic inequalities. Though IPV has traditionally been framed as an issue related to gender alone, a more intersectional understanding of risk and impact can better inform strategies for effective prevention and mitigation.

Key Findings

  • There were 45 victims (43 incidents) of IPV and IPV-spillover homicides from January 2017 through September 2022.
  • The demographic trends among individuals involved in IPH are similar to those of overall homicides: victims and perpetrators are disproportionately Black, young (aged 25-34) and living in high-need areas. Black women represent the highest proportion of victims (37%, n=16), while Black men constitute the highest proportion of perpetrators (56%, n=23).
  • Unlike homicides at large, IPH victimization disproportionately impacts women: 63% of victims of IPH are women.  While IPH accounted for roughly 7% of all homicides from January 2017 through September 2022, they made up 30% of all homicides with female victims.
  • Both victims and perpetrators of IPH had high rates of involvement in human services.  74% of perpetrators had prior involvement with child welfare, publicly funded behavioral health, or homeless and housing systems.
  • 58% of victims had prior involvement with child welfare, publicly funded behavioral health, or homeless and housing systems.
  • Across all gender, race and role categories, about 53% of individuals involved in IPH – 47 of 88 – had criminal justice involvement at some point prior to the homicide incident: 63% of perpetrators (27 of 43) and 44% of victims (20 of 45). Among perpetrators with criminal justice involvement, both Black and White men had higher rates of involvement than either Black or White women.
  • Roughly 24% of all IPV perpetrators had indicators of IPV history in either the criminal courts or child protection system. This is likely an undercount of true IPV history, as data limitations, legal restrictions and underreporting make identification of non-fatal IPV in the data difficult. Among those with domestic violence related criminal cases, the majority occurred in the 18 months prior to the homicide incident.
Current Dashboard

What is this dashboard about?

These interactive dashboards contain information about Landlord/Tenant cases filed in Allegheny County in magisterial district courts from 2012 to the present. Users can see information about the number of cases filed over time, what happens to those cases as they proceed through the courts, how long it takes for cases to proceed through the courts, costs and case outcomes. The data do not record whether an eviction took place (e.g., tenant moved, tenant was ejected) at the end of the case.  The data used for these dashboards are updated daily.

How is this dashboard being used?

With the lifting of the eviction moratorium and phasing out of the emergency rental assistance program, landlord/tenant filings have increased back to pre-COVID levels.  The county is using this information to help target investments that help mediate these conflicts in the hopes of reducing the number of people who ultimately get evicted. 

Children of Incarcerated Parents

Allegheny County sought to update a 2008 analysis examining the demographics and needs of children who have had a parent incarcerated at the Allegheny County Jail. There are other children and youth in the county who have parents incarcerated in state and federal prisons that this report does not address.

What is this report about? 

This data brief presents information on the service involvement, holding status, and child welfare outcomes for incarcerated parents and their children from January 2018 through December 2021.  It is an update of a previous 2008 report that examined the needs of children with incarcerated parents to help identify ways to best support them. 

What are the takeaways?

  • Out of 26,641 people booked in Allegheny County from 2018 through 2021, 51% (13,529) had children 18 or under at the time of booking, totaling 25,335 minor children
  • 58% (7,868) of parents who were incarcerated were Black, compared to 13% of the county adult population.  This means that Black children and parents are disproportionately affected by incarcerations.
  • Most parents (65%, 8,794) are in jail for less than 30 days and only 4% of the parents were sentenced to the jail during this period.  Most of the parents booked are held pretrial (46%, 6,207) or on a local probation detainer (23%, 3,127). 
  • There are county programs to keep children connected with parents who have longer jail stays.  This includes the Allegheny County Family Support Program which provides parenting classes, visitations, phone calls and facilitates support networks for families during and post the incarceration. 
  • In addition to targeted programs, 10,335 of the children of incarcerated parents (41%) were involved in DHS services within a year after parental incarceration  
  • Early childhood services (such as Head Start and home visiting programs) and behavioral health services  (such as mental health counseling) were the most common services used by children of incarcerated parents
  • 1,894 children had a home removal or new placement within a year before or after the parental incarceration.  Of these, 54% (1,022) were placed with kin. 
  • 39% (9,760) of children had a mom who was incarcerated.  Of these, 8% (776) had a home removal.  The largest group of children (194) were removed in the 6 months before the maternal incarceration. 
  • Examining trends in the 30 days pre- and post- incarceration, there is an increase in home removals in the 5 days before an incarceration.  33% (49) of home removals of children that occurred within a month of a mother’s incarceration occurred in the 5 days prior.

How is this report being used?

The county supports children of incarcerated parents in many ways, both targeted and more broadly. Targeted programs include the Allegheny County Family Support Program (operated by Pittsburgh Mercy) which provides parenting classes and supervised visits for incarcerated parents and their children, and Amachi Pittsburgh whose mentorship program supports youth with incarcerated parents. These children also access many other services, which may meet their needs.  The county is using the information in this report to help strengthen and expand targeted services for this population and to improve access to broader services where gaps exist.

Current Plan and Related Documents

This details the County’s plan, including strategies and investments, for implementation of the Community Violence Reduction Initiative.

Overview: 

Working in partnership with the Allegheny County Health Department (ACHD) Office of Violence Prevention and the City of Pittsburgh, the Allegheny County Department of Human Services (DHS) has committed at least $50 million over 5 years to implement evidence-based, comprehensive and well-coordinated public health approaches to reducing community violence.

Additional Information: 

Additional analysis and information will be added as it becomes available. Read more about the initiative and implementation plan, including the communities and strategies here.

Related Data and Analysis: 

Read the latest report and view an interactive map on Homicides in Allegheny County (including the City of Pittsburgh) here.

Examine up-to-date information on homicides in the County and homicides in the City of Pittsburgh.

What are these reports about?

Nationally and locally, policymakers and practitioners are interested in the people who frequently use publicly funded services, particularly crisis services. Most people who use crisis services do so infrequently during a year. A small number of people, however, use crisis services frequently, and sometimes they use more than one type of crisis service.

Allegheny County’s rich integrated data allows us to look at the people who use crisis services. This report summarizes key findings about the people who were involved with one or more of the following four crisis services in the years 2016 through 2017: hospital emergency departments, emergency homeless shelters, mental health crisis programs, and the criminal justice system. This summary report will be followed up by reports examining each of these four service areas in more detail.

What are the takeaways?

  • Of the people who used at least one of the four crisis services examined, 6% (10,655) met the definition of frequent users in at least one system. They accounted for 26% of all service episodes during this period.
  • There is little overlap between frequent utilizers of one type of crisis service and another. Just 9% of users were frequent in multiple systems. This does not mean they didn’t use other services, just that they were not frequent users of those systems.
  • Nonetheless, 26% of frequent users of mental health crisis services were also frequent users of hospital emergency departments, indicating that the emergency room might be a point of intervention for people in mental health crisis.
  • All frequent users of emergency shelter were connected to other human services prior to their first shelter stay during this period. This overlap suggests that although frequent utilizers of emergency shelters were connected to supports, the reasons behind people’s continued use of shelter were not adequately addressed through the services they were receiving.

Black residents are using crisis services at disproportionately high rates, and the disproportionality is more pronounced when looking at frequent utilizers. While 13% of the Allegheny County population is Black, 42% of people who used crisis systems (both frequent and non-frequent) were Black, and 49% of frequent utilizers were Black.

How is this report used?

This work is meant to be exploratory and descriptive in nature to help continue and expand the conversation about how we look at frequent utilizers and potential interventions going forward. By looking more closely at this population of frequent utilizers, we hope to gain insight into their needs, identify key intervention points, and find ways to encourage long-term wellness while reducing the need for repeat intense service usage.

Where can I go for more information?

For questions or suggestions, please reach out to DHS-Research@alleghenycounty.us

Latest data and analysis

An analytic report and interactive map describe homicides in our region using data from the Allegheny County Office of the Medical Examiner and the Pittsburgh Bureau of Police. Focusing on 2016 through 2021, the analysis provides recent and long-term homicide trends as well as comparisons to rates nationally and in other cities. Homicides are just a fraction of gun violence, however, so we also provide data on non-fatal shootings for a more complete picture.

Since gun violence does not affect all geographic locations and populations equally, the analysis describes victim and perpetrator demographics and homicide locations by municipality, neighborhood and census tract. Our research highlights the people and places who are disproportionately impacted by homicide and gun violence in order to inform policy and violence prevention efforts.

What are the key takeaways?

  • Homicide is heavily concentrated in a small number of higher-need communities and overwhelmingly cuts short the lives of young Black men.
  • Both Allegheny County and the City of Pittsburgh saw increases in homicides from 2019 through 2021. This was after stable or declining trends from 2016 through 2019.
  • Firearms were used in nearly 90% of homicides.
  • Homicides usually occurred close to where victims lived. Nearly 90% of victims were murdered within 10 miles of their home. Females were twice as likely as males to be murdered at their own residence.

How is Allegheny County using this data?

Based on the homicide trends presented in this report and research on best practices, the Allegheny County Department of Human Services (DHS) is sustainably funding public health approaches to community violence reduction that are rooted in evidence.

What other homicide data is available?

Two interactive dashboards provide up-to-date data on homicides in the County and homicides in the City of Pittsburgh.


Previous reports about homicide

In October of 2018, the John D. and Catherine T. MacArthur Foundation awarded Allegheny County a Safety and Justice Challenge grant to reduce the population of the Allegheny County Jail by 20%. This series of reports outlines the progress made in the first three years of the project, as well as plans to continue reforms in the criminal justice system, address racial and ethnic disparities and engage community members in this work.

Current report

Allegheny County is committed to allocating criminal justice resources in a systematic way, utilizing evaluation and evidence-based programming to better understand the costs and benefits of various programs. To further this goal, Allegheny County partnered with the Vera Institute of Justice to implement a system of cost–benefit analysis throughout its criminal justice system. The cost analysis includes the cost of an arrest, the cost per day of incarceration or detention, and the cost per day of supervision, including adult and juvenile caseloads, in Allegheny County.

What can we learn from calculating costs in the criminal justice system?

Understanding the drivers of costs within these systems (e.g., changes in population served, changes in operating costs, or both) allows analysts to value the benefits of current and proposed programs. This information is also valuable for policy-makers who can compare the benefits and costs of programs to make informed management, budget and program decisions.

Previous report

From June 2018 to December 2020, the Urban Institute conducted a systemwide assessment of the system response in Allegheny County, PA to intimate partner violence (IPV) to better understand the system as a whole and operations of some key agencies

What is this report about ?

Urban Institute presents the findings from their systemwide assessment. The goals of this assessment were to 1) examine how IPV cases enter the justice and child welfare systems in Allegheny county, 2) analyze agencies’ processes for responding to IPV and 3) recommend ways the county can improve responses to IPV.

What are the recommendations?

  • Have county leaders prioritize IPV
  • Shift the focus from case outcomes to people’s experiences, especially during early encounters with formal services.
  • Reinstate and sustain IPV-focused fatality reviews and ensure they embrace a non-blaming culture.
  • Establish a specialized IPV unit in the Allegheny County Public Defender office
  • Differentiate IPV from DV throughout all systems.
  • Record survivor information consistently and securely share it when possible.
  • Prioritize and improve referrals to batterers’ intervention programs
  • Create a mechanism to consistently track aggressors’ and survivors’ experiences at system entry points.


How is this report being used?

The county executive and Mayor of the City of Pittsburgh created an IPV Reform Leadership task force in May 2022 to actively work on addressing these recommendations and improving the system.

In response to the COVID-19 pandemic, many jurisdictions across the country took measures to reduce their jail populations as a way of lessening the risk of disease spread. This included Allegheny County, which decreased the Allegheny County Jail (ACJ) population by considering for release older and health-compromised individuals, individuals sentenced to the jail who could be paroled early, and individuals awaiting trial or probation violation hearings who could safely be released.

This data brief explores the decrease of the ACJ population between March 16, 2020, and June 1, 2020, and the recidivism of individuals released during this period.

What are the takeaways?

  • The ACJ population decreased 30% between March 16, 2020 and June 1, 2020, as a result of both decreased jail bookings and increased releases of eligible individuals.
  • Of those who were released during the early months of the pandemic, most were being held in the ACJ while awaiting a hearing for a County probation violation (34%) or awaiting trial (29%).
  • Many individuals who were released from jail during this period (63%) received support services through Pretrial Services, Re-Entry/Justice Related Services, or Adult Probation.
  • The people released from the jail during this period had a recidivism rate (i.e., a new criminal filing or jail booking within 90 days of release) of 11%. A comparison group of individuals who were released from the jail during the same period a year prior had a recidivism rate of 19%.

The City of Pittsburgh Bureau of Police (PBP) tracks each incident in which an officer uses force with a subject. The most current report on police use of force and the previous report provide an overview of incidents in Pittsburgh. The reports describe trends, circumstances of incidents, control techniques used, and incident outcomes. The analyses also describe charges commonly filed against subjects, subjects’ demographics, and the distribution of incidents across the police force.

What are the takeaways?

  • Around one in 10 total arrests involve the use of force.
  • Most subject resistance (SR) incidents resulted from some form of attempted arrest: 74% of subjects resisted arrest during an on-view arrest (an arrest where probable cause is established by observing or “viewing” an offense), and 4% resisted during a warrant arrest.
  • The most commonly used control techniques were forcible handcuffing (used with 68% of resisting subjects) and “other,” which includes grabbing, pushing and pulling (58%), and takedowns (51%). Note that more than one control technique can be used and reported.

Previous reports:

Use of Force in Pittsburgh, 2010–2015

In Allegheny County, a preliminary arraignment is a defendant’s first court appearance, during which a judge notifies the defendant of their charges and a bail determination is made. Defendants are not guaranteed legal representation at preliminary arraignments, but lack of representation can have serious consequences for fairness and equity in court proceedings, as well as a substantial impact on the jail population.

What is this report about?

In April 2017, the Allegheny County Office of the Public Defender began a pilot project utilizing existing staff to provide legal representation for all people arraigned during business hours at Pittsburgh Municipal Court.

What are the takeaways?

The outcomes of the first year of the pilot are encouraging. Compared to a matched sample, people represented by public defenders at preliminary arraignments:

  • Were less likely to receive cash bail
  • Were less likely to be booked into the Allegheny County Jail
  • Experienced less racial disproportionality in cash bail decisions and jail bookings

Click here to read the data brief.