An analytic report and interactive map describe homicides in our region using data from the Allegheny County Office of the Medical Examiner and the Pittsburgh Bureau of Police. Focusing on 2016 through 2021, the analysis provides recent and long-term homicide trends as well as comparisons to rates nationally and in other cities. Homicides are just a fraction of gun violence, however, so we also provide data on non-fatal shootings for a more complete picture.
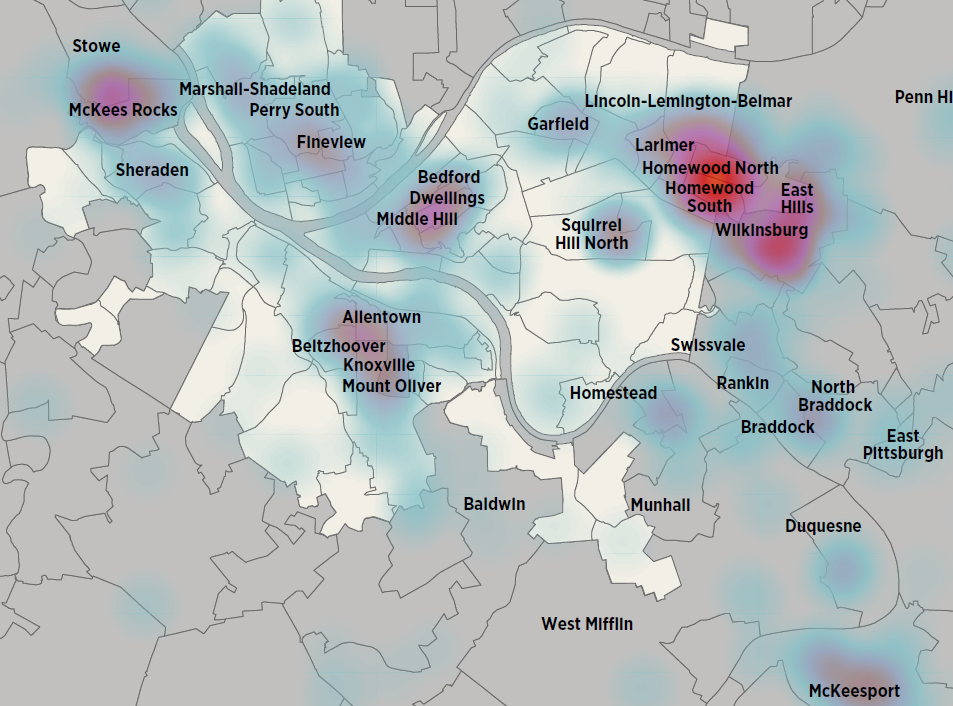
Since gun violence does not affect all geographic locations and populations equally, the analysis describes victim and perpetrator demographics and homicide locations by municipality, neighborhood and census tract. Our research highlights the people and places who are disproportionately impacted by homicide and gun violence in order to inform policy and violence prevention efforts.
What are the key takeaways?
- Homicide is heavily concentrated in a small number of higher-need communities and overwhelmingly cuts short the lives of young Black men.
- Both Allegheny County and the City of Pittsburgh saw increases in homicides from 2019 through 2021. This was after stable or declining trends from 2016 through 2019.
- Firearms were used in nearly 90% of homicides.
- Homicides usually occurred close to where victims lived. Nearly 90% of victims were murdered within 10 miles of their home. Females were twice as likely as males to be murdered at their own residence.
How is Allegheny County using this data?
Based on the homicide trends presented in this report and research on best practices, the Allegheny County Department of Human Services (DHS) is sustainably funding public health approaches to community violence reduction that are rooted in evidence.
What other homicide data is available?
This interactive dashboard provides up-to-date data on homicides in the County and City.