Access the report

In 2015, the U.S. Department of Housing and Urban Development (HUD) overhauled its regulations governing services to people experiencing or at-risk for homelessness. The new guidelines required local agencies operating emergency housing programs to implement a coordinated entry (CE) system to prioritize the most vulnerable clients. The policy emphasized getting clients into stable housing immediately, without preconditions.

While implementing a coordinated entry system was a major shift for Allegheny County Department of Human Services (DHS) and its housing providers, they embraced the challenge, seeing an opportunity to improve equity, efficiency and effectiveness in connecting people to housing and other service interventions. The report describes how DHS established a coordinated entry system and is continuing to utilize data to make improvements in housing prioritization.


Related materials

Recent national and local focus on Veterans who are experiencing homelessness has led to reduction in homelessness in this population. In order to provide more information about these individuals, this report describes Veterans in Allegheny County who received homeless assistance services at least once from 2014 through 2018, including details on demographics, housing program types and involvement with other County services. In order to sustain progress and to further prevent and reduce Veteran homelessness as much as possible, Allegheny County agencies and community partners will benefit from leveraging data to identify patterns in Veteran homelessness, track outcomes and inform  practices for addressing Veterans’ housing needs.

What are the takeaways?

  • The number of Veterans entering homeless assistance programs in Allegheny County declined by 45% from 2014 through 2018. By contrast, non-Veterans saw slight decreases in program entries.
  • Underlying racial disparities in homelessness persisted among Veterans and non-Veterans alike. More than half of Allegheny County Veterans who accessed homeless assistance programs were Black. This proportion is consistent with the racial demographics of all people (Veterans and non-Veterans) who used these types of services in the region.
  • Veterans who left the homeless system after receiving services were found to be slightly less likely than non-Veterans to re-enter the homeless assistance system, suggesting that they were able to find and maintain stable housing.

The Emergency Rental Assistance Program offers financial assistance for people struggling to pay rent or utilities due to COVID-19. These dashboards track data about the program, those who have applied, and those who have received funds.

Trouble viewing the dashboard? You can view it directly here.

What is the Community Need Index?

The Allegheny County Department of Human Services (DHS) conducts a Community Need Index (CNI) to identify specific areas that are in greater need, and face larger socioeconomic barriers, relative to others. The newest version of the CNI index ranks neighborhoods by need level by looking at:

  • The percentage of families who live below the poverty line
  • The percentage of unemployed males
  • The resident education levels
  • The percentage of single mothers
  • The number of 911 dispatches for gun shots fired

The researchers used a census tract level to break up the region and assess needs. Census tracts are static, relatively small subdivisions of a county.

How can I view the findings?

A storymap presents the findings in an interactive and accessible format. An interactive map allows users to view and extract data from the 2018 CNI. The new report focuses on all of Allegheny County, examines changes in need over time, and places emphasis on the connection between race and community need. Earlier reports are linked below.

What are the takeaways?

  • Levels of need among Allegheny County census tracts have stayed mostly consistent with the previous analysis 5 years ago.
  • 89% of tracts that were high or extreme need within 2009 to 2013 (5-year estimate) were still high or extreme need in this latest report.

How is this report used?

The geographic dimensions of community need can help inform many aspects of DHS’s strategic planning and resource allocation decisions, such as decisions on where to locate Family Centers or new after-school programs.

Where can I go for more information?

For more information, you can read previous reports below. Or you can reach out to DHS-Research@alleghenycounty.us with any questions.


Previous reports in this series 

2014 update (suburbs)
• 2012 update (suburbs)
2000-2009 (suburbs)
2000-2012 (city)

Previous datasets in this series

2014 (suburbs)
2000-2012 (city)

Input from community members is vital to the work that Allegheny County Department of Human Services (DHS) does. One way that DHS is learning about the community’s needs is by posing questions on a public online feedback platform called Neighborland. DHS is reviewing and summarizing the answers we receive and analyzing the text for common themes. Feedback is being used to inform our planning and programming.

Since 2010, ACTION-Housing’s My Place program has provided housing and case management to Allegheny County youth who are either transitioning out of foster care or at-risk for homelessness. In 2013, ACTION-Housing built a modern, energy-efficient structure — the 24-unit Uptown Lofts — with the belief that services could be offered more effectively if many young adults were living at a single location. This report provides an overview of ACTION-Housing’s youth-focused programs and how it has found success serving vulnerable youth through supervised independence; clear expectations; and motivating, compassionate support staff.

Click here to read the report.

Two housing programs in Allegheny County, Rapid Rehousing (RRH) and the Housing Choice Voucher Program (HCV, or Section 8), provide monetary assistance to households so that families can rent from private landlords and live in the communities of their choice. While participant choice is a potential benefit of both programs, the reality is that where participants live is often limited. Fair market rent calculations, source of income discrimination, zoning laws, and participants’ eviction and credit records can all create obstacles for housing program participants seeking rental units.

Since place has a profound influence on the outcomes of children and adults, we wanted to explore the degree to which individuals and families in RRH and HCV programs moved to disadvantaged census tracts. Analysis found that approximately half of households in the two programs moved to highly or extremely disadvantaged census tracts, even though only 18% of all census tracts in Allegheny County were classified as such. Key findings of the analysis include:

  • 54% of HCV households and 41% of RRH households moved to highly or extremely disadvantaged census tracts in 2017.
  • A small fraction of households (17% of HCV households and 25% of RRH households) moved to census tracts considered to be opportunity tracts with low disadvantage.
  • Race was the most statistically important factor impacting where households tended to move. For example, Black females with children were roughly twice as likely as White females with children to move to highly or extremely disadvantaged tracts.
  • Moving patterns persisted over time; a comparison of HCV rental locations in 2010 versus 2017 showed that program participants tended to move to the exact same census tracts across the two years, not just the same sort of census tracts (i.e, tracts with similar levels of disadvantage).

Read the full report here.

Since financial stability is an important part of people’s ability to live healthy and independent lives, Allegheny County Department of Human Services (DHS) wanted to learn more about the work experiences of its clients. Using data from the Allegheny County Data Warehouse and 2018 State Unemployment Insurance records, we found that the majority of eligible DHS clients were disconnected from the labor force in 2018, and those who were able to find work tended to earn less than other Allegheny County workers.

The analysis found that:

  • 52% of the client sample was disconnected from the labor force in 2018.
  • Only 24% of the client sample worked in all 4 quarters in 2018.
  • Among clients who worked in all 4 quarters, 38% had earnings that fell below the federal poverty line.
  • Even when holding constant occupation and industry, DHS clients appear to be working in lower-paying positions than the average Allegheny County worker.

But there were bright spots for some DHS clients:

  • 9% of clients had earnings that exceeded the Allegheny County median.
  • The utilities industry offered the highest earnings for DHS clients, who had mean earnings of more than $40,000 per year.

By investigating employment experiences, DHS and its partners can gain insight into clients’ economic challenges and tailor services like education and job training to better meet the needs of clients and employers.

Read the full report here.

Allegheny County homeless service programs are assessed yearly as part of a process of evaluating and prioritizing projects for funding. This evaluation process has historically been based on administrative data about clients’ housing and self-sufficiency outcomes. In order to more fully evaluate these services – and to align with suggestions from the U.S. Department of Housing and Urban Development – DHS and other stakeholders are piloting feedback methods and tools to better understand clients’ experience with the services they receive. During the first iteration of the pilot, more than 200 clients receiving a range of homeless services responded to a survey by text, online or in person.

This report describes the 2018 pilot process for the development and administration of the survey, analyzes findings from the survey, and discusses insights and recommendations for future survey administration.

Read the report here.

The Homeless Services and Supports Coordination (HSSC) program, implemented by the Allegheny County Department of Human Services in 2013, provides comprehensive service coordination for families who use emergency homeless shelters. Upon entering an emergency shelter, participants meet with service coordinators who offer a range of assistance, from accessing public benefits to finding affordable housing, childcare and job training programs.

As part of a wider effort to systematically collect client feedback, a pilot survey was conducted to examine (1) client satisfaction with HSSC services they received and (2) feasibility of using text messaging as a way of gathering feedback from clients in the homeless system. This report presents findings from that survey.

The dashboard below displays data about homelessness programs in Allegheny County and the clients using them. Data comes from the Allegheny County Homeless Management Information System (HMIS). Data is available from January 1, 2014 through the present and is updated daily (with a lag time of one day).

Problems viewing the dashboard? You can view it directly here.

Related materials

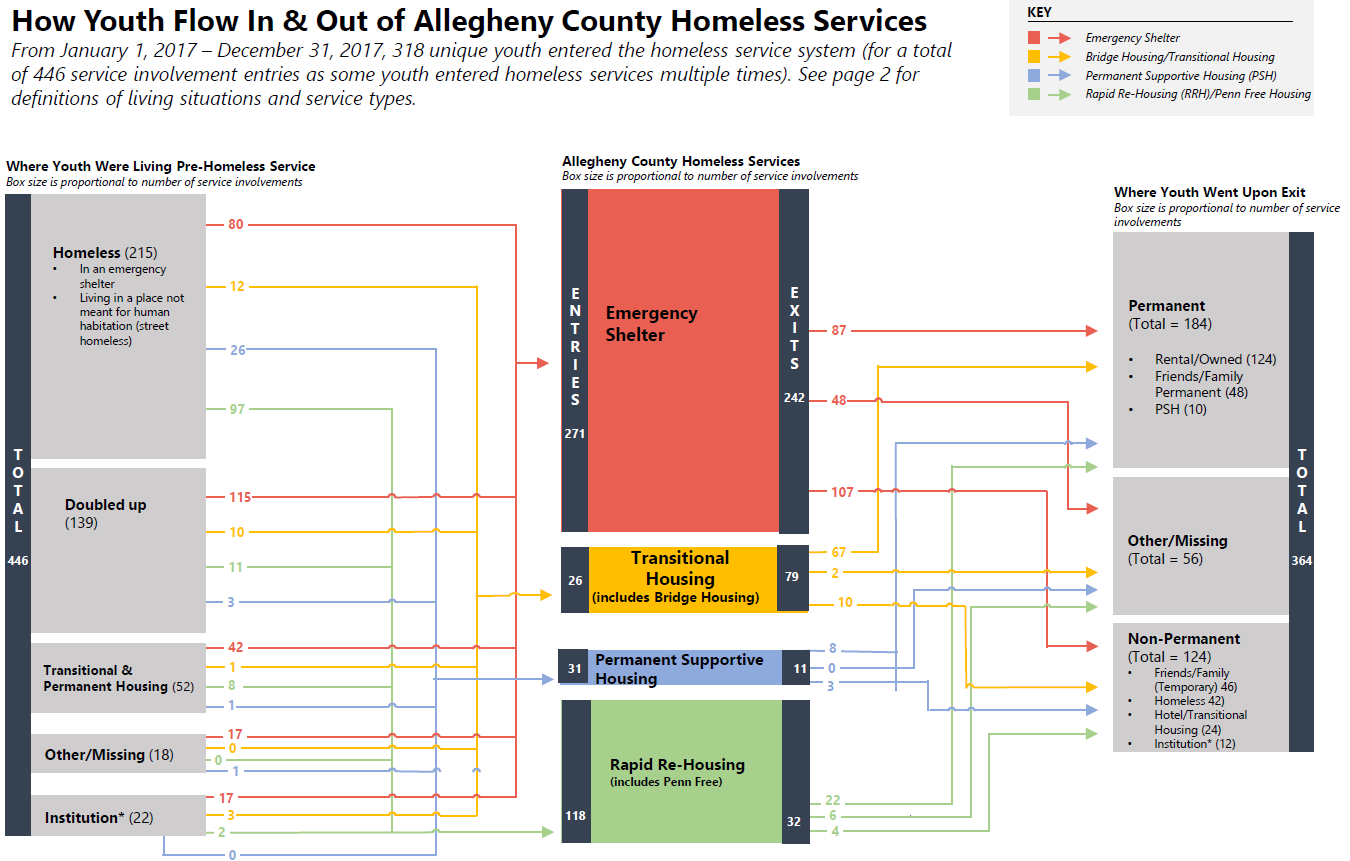
This infographic depicts the flow of homeless youth in and out of Allegheny County’s homeless service system in 2017. Analyzing the housing services that youth used — in addition to the places they were residing before and after receiving these services — helps inform outreach efforts and service planning. This is part of an effort to prevent and divert youth from homelessness and improve the housing outcomes of youth who do experience homelessness.

Using data from the County’s Homeless Management Information System (HMIS), 318 youth ages 18-24 who used a homeless service between January 1, 2017 and December 31, 2017 were identified. Residence before and after service utilization were self-reported by youth. Some youth entered the homeless system multiple times during this period for a total of 446 service involvement entries during the period of study. Not all youth who entered a homeless service in 2017 exited within the same year; as a result, total entries into service do not equal exits.

The left side of the chart shows where youth were residing prior to their use of homeless services. The most frequent location was in an emergency shelter or on the street (i.e., in a place not meant for habitation). The middle of the chart displays the homeless services used by youth; emergency shelters were accessed most frequently followed by transitional housing services. The right side of the chart displays where youth went after leaving a homeless service. Most youth went to permanent living situations, though many also went to non-permanent locations and data was not available for about a quarter of service exits.

Click here to view the infographic for 2017. 

An infographic about services used by homeless youth in 2016 is available here.

This infographic depicts the flow of homeless youth in and out of Allegheny County’s homeless service system. Analyzing the housing services that youth used — in addition to the places they were residing before and after receiving these services — helps inform outreach efforts and service planning. This is part of an effort to prevent and divert youth from homelessness and improve the housing outcomes of youth who do experience homelessness.

Using data from the County’s Homeless Management Information System (HMIS), 260 youth ages 18-24 who used a homeless service between January 1, 2016 and December 31, 2016 were identified. Residence before and after service utilization were self-reported by youth. Some youth entered the homeless system multiple times during this period for a total of 321 service involvement entries during the period of study. Not all youth who entered a homeless service in 2016 exited within the same year; as a result, total entries into service do not equal exits.

The left side of the chart shows where youth were residing prior to their use of homeless services. The most frequent location was a doubled-up situation, i.e., living with a friend or family member in a place where they could not stay permanently. The middle of the chart displays the homeless services used by youth; emergency shelters were accessed most frequently followed by transitional housing services. The right side of the chart displays where youth went after leaving a homeless service. Most youth went to permanent living situations, though many also went to non-permanent locations and data was not available for about a quarter of service exits.

Click here to view the infographic.

The Allegheny County YOUth Count survey was initiated in 2015 to gain a more accurate count of youth experiencing housing instability. Data gathered was meant to enhance yearly HUD-required Point-in-Time (PIT) homelessness counts to determine how best to connect this population with the services they need. This data brief outlines key findings of the 2016 survey and explains the County’s ultimate decision to conduct two PIT counts next year and enlist the help of youth-serving providers to collect data rather than designing a separate survey.

Click here to read the full data brief. 

Implemented at the end of 2013 and designed to provide service coordination and supports for families accessing Allegheny County’s four emergency homeless shelters, the Homeless Services and Supports Coordination program (HSSC) served about 300 families with children in its first year.  This evaluation was designed to elicit information about participants’ experiences with HSSC services as well as their overall shelter experience.  Among other findings, it found that staff personality and style of interaction were essential elements of what made the program successful. The report discusses the implications of this and other findings as well as opportunities for consideration going forward.

Click here to view the full report.