Needs Assessment of Economic Security

Access the report

From May through August 2024, Allegheny County Department of Human Services (DHS) engaged in a comprehensive needs assessment. The purpose of the assessment was to determine how DHS can best address the needs of individuals and families living in poverty and promote stability and economic security using Community Service Block Grant (CSBG) funds and other flexible funding across the agency. The assessment included collection and analysis of qualitative and quantitative data from community members and service providers.

Read the new report here.

What are the takeaways?

  • Despite a decrease in the overall poverty rate, there remain deep disparities in poverty by demographic groups. Black people, women with children and people with less than a high school diploma experience poverty at twice to three times Allegheny County’s rate.
  • Finding job opportunities was the number one challenge reported by survey respondents seeking employment. Additional barriers to employment include transportation and resumé/application preparation.
  • Workforce participant engagement for those receiving SNAP and TANF (i.e., those with low income, for whom relevant data are available) increased from 2021 to 2022, possibly explained by COVID-related participation extensions. The demand for job readiness/training programs among this population, particularly for SNAP recipients who are female and Black, is expected to increase further as SNAP work requirement waivers expire in 2025.
Access the report

The Intimate Partner Violence Reform Initiative was created in May 2022 to coordinate policy and system-level work across agencies in Allegheny County to improve a complex and fragmented system for both survivors of intimate partner violence (IPV) and those who use violence.

Stakeholders from local and federal criminal justice systems, victim service organizations, community groups, healthcare and human services are working to improve the ways in which people can access help, how our systems work together and share information, and how we can prevent the most serious harm. This report outlines the progress made in the first year of the initiative, as well as plans and priorities to continue these reform efforts.

Current information

The Allegheny County Department of Human Services (DHS) funds programs to assist young adults who are transitioning out of the child welfare system (also known as transition-aged youth) to secure employment, education, housing, behavioral health services, financial advice and more. Despite these service offerings, transition-aged youth have higher rates of homelessness, substance use, mental health challenges and incarceration, as well as lower rates of high school graduation compared with people who were not involved with the child welfare system. While targeted services are important, some human service needs result from poverty, which can be mitigated by providing direct financial assistance.

What is this report about?

In the summer of 2023, DHS launched a direct cash support program called Cash Assistance for Allegheny Young Adults (CAAYA), which provided a one-time payment of $4,000 to young adults, ages 18 through 22, with a history in the child welfare system, who were experiencing homelessness or were young parents who had an open case with Allegheny County’s child welfare office. In this report, we present a mixed-methods approach to evaluating the impact of CAAYA, including longitudinal surveying, a quasi-experimental analysis of administrative data in the Allegheny County Data Warehouse, and semi-structured interviews with cash recipients.

What are the takeaways?

  • CAAYA recipients demonstrated significant financial need. At the launch of the program, only 35% reported being currently employed and only 29% reported being in school either full-time or part-time. Those who had some form of formal employment in the 12 months before the program had mean annual earnings of $10,174. Twenty-eight percent had one or more children.
  • CAAYA recipients also lacked financial support within their community. Two-thirds of recipients reported not knowing anyone who would lend them $500 in a time of crisis.
  • Overall, the program encouraged about 100 individuals to open a bank account. Seventy-five percent (n = 774) of recipients chose to receive the money via bank account transfer and 25% via a virtual gift card.
  • Recipients used the cash assistance quickly. On average, $2,769 of the $4,000 was spent within the first month.
  • Car-related expenses ranked as the number one item for planned expenditures, and there was a 41% relative increase in car ownership three months after receiving the money.
  • The program improved self-reported well-being after receiving financial assistance, but the effects faded in the subsequent months.
  • CAAYA recipients increased their use of mental health outpatient therapy by 7% compared to a control group of individuals who were narrowly ineligible for the program. There was no change in utilization of crisis and inpatient services. In contrast to self-reported well-being, the program’s impact on usage of outpatient mental health services persisted for at least eight months after receiving funds.

How is this report being used?

As a result of this program, we are exploring additional opportunities to leverage cash assistance with this population to increase engagement in holistic supports and services. We are also considering longer-term programs with more frequent, smaller payments to targeted populations.  For future programs, we hope to receive state waivers for the impact of cash assistance on public benefits, especially if a program is designed to include ongoing payments.

For other local governments or providers who are considering cash assistance programs, we hope this report serves as a resource for program design and evaluation. Local governments should note that the success of the CAAYA program would not have been possible without our partner organizations. Trust in government significantly impacts the accessibility of services, particularly for marginalized communities. When first hearing about the cash assistance, many individuals who were eligible to receive the money thought that it was a scam. This skepticism was eased by having multiple trusted intermediaries ensure that it was a real program and that they should apply.

The Allegheny County Department of Human Services (DHS) partnered with Pittsburgh Regional Transit (PRT) to launch a transportation assistance program called Allegheny Go. This program offers half-price PRT rides for county residents ages 12 to 64 who receive Supplemental Nutrition Assistance Program (SNAP) benefits, and do not receive any other transit fare discounts. 

Allegheny Go builds on the success of the Allegheny County Discounted Fares Pilot Program, which ran from November 2022 through June 2024.  

This dashboard describes the application process and reports on application statistics and participant demographics.  

DHS has set a goal of enrolling 15,000 participants in Allegheny Go. This dashboard tracks progress towards that goal. Staff monitor how many applications are received, how many are eligible, and make sure eligible participants receive their discounts.  

Community Need Index

Current dataset and related materials

What is the Community Need Index?

The Allegheny County Department of Human Services (DHS) conducts a Community Need Index (CNI) to identify specific areas that are in greater need, and face larger socioeconomic barriers, relative to others. The newest version of the CNI index ranks neighborhoods by need level by looking at:

  • The percentage of families who live below the poverty line
  • The percentage of unemployed or unattached males
  • The percentage of those aged 25 and up without at least a Bachelor’s degree
  • The percentage of single parent households
  • The percentage of households without internet access
  • Rate of homicide per 100,000 residents
  • Rate of fatal overdoses per 100,000 residents

The researchers used a census tract level to break up the region and assess needs. Census tracts are static, relatively small subdivisions of a county.

How can I view the findings?

An interactive map allows users to view and extract data from the 2024 CNI (which uses 2022 five-year data estimates and totals). The new report focuses on all of Allegheny County, examines changes in need over time, and places emphasis on the connection between race and community need. Earlier reports are linked below.

What are the takeaways?

  • In Allegheny County, we continue to find the highest levels of need in specific sections of the City of Pittsburgh (Hill District, South Hilltop, parts of the West End, Upper East End neighborhoods, Upper Northside) as well as census tracts outside the City of Pittsburgh (Mon Valley, sections of the Allegheny County River Valley, sections of Penn Hills, sections of Wilkinsburg, Stowe-Rocks).
  • There are vast discrepancies between the lowest need communities, which have an average poverty rate of 2%, and the highest need communities, where the average poverty rate is 38%.
  • With few exceptions, census tract-level community need is persistent over time.
  • Only about one-third of Allegheny County’s Black residents live in lower-need communities. For every other racial and ethnic group in the County, the majority of residents live in lower need communities. Black communities in Allegheny County have disproportionately high levels of need, as do a number of racially mixed communities. 
  • Poverty status alone does not account for where various racial and ethnic groups tend to live by level of need; poor Black and Latino families are more likely than other poor families to live in higher need communities. Even Black families above the poverty line are many times more likely than their Asian, White and Latino peers above the poverty line to live in higher need communities.

How is this report used?

The geographic dimensions of community need can help inform many aspects of DHS’s strategic planning and resource allocation decisions, such as decisions on where to locate Family Centers or new after-school programs.

Where can I go for more information?

For more information, you can read previous reports below. Or you can reach out to DHS-Research@alleghenycounty.us with any questions.


Previous reports in this series 

Previous datasets in this series

Current Plan and Related Documents

The Allegheny County Department of Human Services (DHS) partnered with Pittsburgh Regional Transit (PRT) to launch a new transportation assistance program in November 2022 called the Discounted Fares Pilot. This program offered free and reduced-price PRT rides for county residents ages 18 to 64 who receive Supplemental Nutrition Assistance Program (SNAP) benefits, along with their 6- to 17-year-old children. The fare discounts were allocated using a lottery. Each household in the pilot was randomly assigned to one of three groups, each with equal probability. One group received unlimited free PRT trips, a second group received a 50% discount on all PRT trips, and a third group received no discount. The fare discounts lasted for at least 12 months for the free-fare and half-fare groups.  

What is this report about?

This report first describes the results from the first year of the pilot.  It describes the design of the pilot, the characteristics of the participants and provides estimates of the causal impact of the fare discounts on travel behavior and health care utilization.  It also reports on impacts on self-reported outcomes related to employment, financial stability, and well-being.

What are the takeaways?

  • A total of 9,544 adults and 4,928 children enrolled in the Pilot during the three-month open enrollment period. The majority of adult participants were female (72%) and Black (59%). Participants reported taking an average of ten PRT trips per week and spending an average of nearly $30 on public transportation per week at the time they enrolled in the Pilot.
  • Most participants successfully received their Pilot-issued farecard and used the card at least one time. 90 percent of adults in the free-fares group tapped their assigned farecard at least once. 82 percent of the half-fares group and 81 percent of the no-discount group tapped their farecard at least once. The majority of farecard non-users likely never received their assigned card.
  • Larger fare discounts resulted in greater use of Pilot-issued farecards. Participants in the half-fares group tapped their assigned farecards an average of 1.6 more times per week than the no-discount group. Participants in the free-fares group tapped their assigned farecards an average of 3.3 more times per week than the half-fare group. 
  • The fare discounts yielded improvements in certain measures of financial savings and transportation security. In particular, the free fares reduced self-reported weekly spending on PRT trips by more than $17 relative to no discount while there was an $8.92 decrease in weekly spending on average for the 50% discount group. Free fares led to a 26 percentage-point decrease, while 50% discounts resulted in a 10 percentage-point drop in the self-reported likelihood of missing work or other appointments in the past four weeks due to transportation issues.
  • Discounted fares had limited effects on health care utilization, with no clear patterns emerging in terms of increased or decreased use of care. The fare discounts had no discernible impact on participants’ likelihood of receiving Medicaid-funded health care in the first 270 days after they enrolled in the Pilot.

How is this being used? 

DHS is using the Pilot results to better understand the ways that low-income households may benefit from reduced PRT fares. We will continue to refine our understanding by analyzing longer-term outcomes and by incorporating insights from qualitative interviews that were conducted with a subset of participants. These findings will be shared in a future publication.

DHS has also used the preliminary Pilot results to inform the design and implementation of a longer-term program that will offer a 50% PRT discount for working-age county SNAP beneficiaries and their children. This new program, called Allegheny Go, is scheduled to launch in June 2024.

Other information

Research Plan

Each year, Allegheny County participates in a national census, required by the U.S. Department of Housing and Urban Development (HUD), of the number of people experiencing homelessness on a single night. The Point-in-Time count enumerates people experiencing homelessness in the County who are sheltered (residing in emergency shelters), unsheltered (residing in places not meant for human habitation) or participating in a short-term, supportive housing program (transitional and safe haven).

While the Point-in-Time count allows for annual comparisons, DHS also maintains a real-time dashboard that tracks the daily number of people in emergency shelters and a weekly count of people known to be experiencing unsheltered homelessness based on their engagement with street outreach teams. 

What are the key takeaways from the 2024 count?

  • On January 30, 2024, in Allegheny County, 1,026 individuals were staying in emergency shelters or experiencing unsheltered homelessness (compared to 913 in 2023).  
    • 857 were staying in emergency shelters (84% of overall count)  
    • 169 were unsheltered (16% of overall count)  
  • An increase in the number of individuals staying in emergency shelter (+99) is largely responsible for the increase in the number of people experiencing homelessness in the 2024 count. 
  • The number of individuals experiencing unsheltered homelessness increased (+14) since 2023, but the percent increase of 8% is smaller than the year-over-year increases in 2022 and 2023, which were 62% and 48%, respectively. 
  • Adult-only households differ from adult-child households both demographically and in how they access and use shelter, which is why we look at these populations separately in this year’s brief. 
  • Among individuals in adult-only households (n=702): 
    • The majority (76%) were staying in shelters. 
    • Men were overrepresented in both sheltered (64%) and unsheltered (66%) locations. 
    • White adults were more likely to be unsheltered (57%) than adults of other races, but Black adults were overrepresented in shelters and in unsheltered locations, as Black individuals make up only 14% of the County’s population. 
    • The unsheltered adult population skewed slightly younger than those who were in shelter; a third of sheltered adults were 55+ (vs. 13% of those unsheltered). 
    • Veterans made up a small percentage of both the sheltered (7%) and unsheltered (5%) populations.  
    • There were 30 adult survivors of domestic violence in shelter (6%); in surveys, an additional three unsheltered individuals mentioned intimate partner violence as a factor leading to their homelessness. 
  • Among the 324 individuals in adult-child households, all of whom were staying in shelter: 
    • Women/girls were overrepresented (61%), skewed by female-headed households. 
    • Black individuals were significantly overrepresented, at nearly 70% of those in family shelters. 
    • There were 93 unique households and they tended to be younger families; most adults were under 45 and 60% of the family shelter population was under 18. 
    • Almost a quarter of adults staying in family shelter were survivors of intimate partner violence.

How are these reports used?

The data collected during the yearly Point-in-time is submitted to HUD, to create a yearly homelessness assessment report presented to congress. For more information, visit the HUD website on the Point-in-Time Count, linked here.

Allegheny County uses the yearly data as a component of its work to understand trends and needs, informing the County’s strategies to reduce homelessness and better serve those experiencing it.

Previous Reports in this series

DHS Goals and Key Initiatives: 2024

Current information

DHS has set five goals to guide us and our partners in serving our community well. We aim for our network for human services to improve access to care, prevent overuse of coercive services, prevent harm, increase economic security and ensure quality.

What is this report about?

DHS can reach our goals more quickly if we devote time and attention to several big, bold initiatives that will make our systems and our organization work better for everyone we serve. This document outlines our key initiatives in 2024—which are in addition to our core work of running effective systems of care for people.

DHS 2023 Accomplishments

Current information

County human services includes programs from over 300 community-based agencies and is delivered by social workers, peers, and outreach staff working all throughout the county. These staff run out-of-school-time programs, answer hotlines, investigate reports of potential harm to children and vulnerable adults, deliver meals to seniors and run Senior Centers, make home visits to families with newborns, and do the administrative work that makes our human services run efficiently.

What is this report about?

This report highlights the 2023 accomplishments that stood out. There are many, many other achievements that people told us about. We chose the ones that made the biggest difference.

Current Information

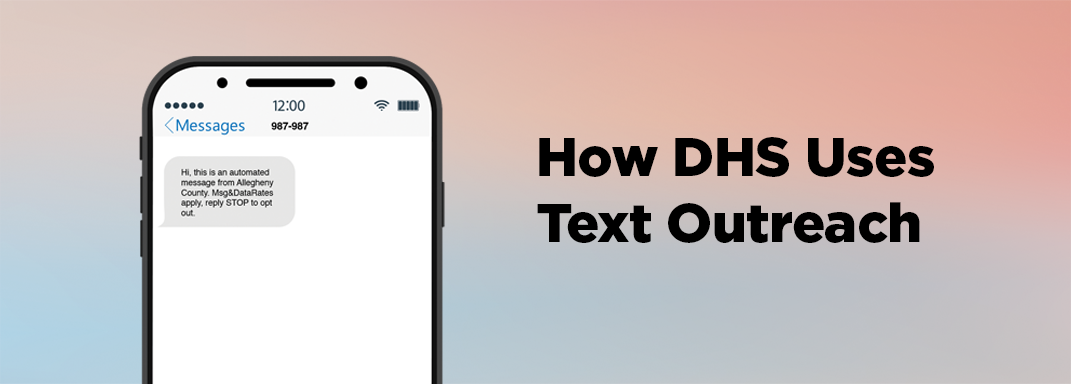
Allegheny County DHS sends text messages to county residents for a variety of reasons, including increasing awareness of services, providing timely reminders, and gathering feedback after a service experience.  In addition, DHS uses this information to help evaluate and monitor programs it delivers.  This dashboard displays information about these outreach and engagement efforts, including the subject and purpose of these and the rates of engagement.  Data on DHS’s texting efforts are available from November 2017 to the present.

The dashboard allows users to examine DHS text messaging as a whole as well as drill down to individual text campaigns.  It allows users to understand the purpose of each campaign, the number of messages sent and the demographics of the people being contacted by each campaign.  DHS collects this information through Community Connect Labs (CCL), DHS’s texting software, and information is updated daily. Click here for a more detailed report on DHS’s texting outreach from 2018-2022.

In Allegheny County, a network of shelters provides temporary places to stay for people experiencing homelessness. Allegheny County’s emergency shelter network includes facilities that serve only adults and others that offer spaces to families with children or other dependents (family shelters).

This data brief focuses on the group of approximately 598 people in 184 households that enrolled in one of six family shelters at least once from April 2022 through March 2023. People are eligible for family shelters if they are 1) an adult with a minor child(ren) or a child over 18 years old still enrolled in high school, 2) a woman or couple without a minor child where the woman is in her third trimester of pregnancy, or 3) a couple unable to separate or parent with an adult child where one is caregiving for the other.

See the related data briefs, “People Using Adult-Only Emergency Shelters in Allegheny County” and “People Experiencing Unsheltered Homelessness in Allegheny County for descriptions of other people served in the homeless system

  • Ninety percent (N=165) of heads of household who used family shelters were female and Black individuals were over-represented – 77% of heads of households were Black, but Black individuals only make up 14% of the county. Most households (71%) consisted of an adult female head of household and one or more children. Forty-nine percent of children (N=179) were age 5 or younger at the time they entered a family shelter. An additional 35% were ages 6 through 12 and 16% were ages 13 through 17.
  • Most families had not recently used the shelter system and only stayed once. 84% of families only used shelter once during this period and only 6% had used a shelter or County housing program in the year prior to their first stay.
  • Although half of families stayed in shelter for more than two months, the largest group of families exited within a week of entering. Seventy-nine percent (N=153) of all stays resulted in households exiting to stable housing, which includes a County housing program (32%), housing with family or friends (27%), or an owned or rented property (19%). An additional 19% exited to another shelter.
  • Income is limited for heads of household using family shelters. 70% (N=129) of heads of household self-reported income from any source, with an average monthly income of $923. Additionally, DHS was able to access Pennsylvania Labor and Industry information for 171 individuals in this cohort (93%). Of these heads of household, 47% (N=81) had earnings, with an average monthly income of $1,243.
  • About a third of Medicaid-enrolled heads of household used behavioral health services, most of which were mental health outpatient services. The most common diagnosis was acute stress disorder (30% of people with a diagnosis), a short-term mental health condition that can occur within the first months after experiencing a traumatic event.
  • Asthma was the most common chronic condition for Medicaid-enrolled children using shelter and the second most common for heads of household. Asthma rates for both are twice as high as those in the general Medicaid-enrolled population in the County
  • Fifteen percent of families using these shelters had an active child welfare case in the year prior to their stay. This could indicate the need for additional support and safety nets within the child welfare system or as families transition out of it.

Emergency shelters are meant to be short-term accommodations for people experiencing a crisis. The County’s goal is to ensure that shelter stays are rare, brief and non-recurring.  The County is working with shelter staff and other housing providers to support client moves to stable housing when possible, with the goal of improving their overall outcomes and ensuring that short-term beds are available when people need them. 

Making good, informed decisions about how to allocate limited resources is an ever-evolving process. The Allegheny County Department of Human Services (DHS) strives to make the most equitable decisions when allocating scarce resources for individuals and families in need. Housing is a critical resource for which demand far exceeds supply; thus, DHS is dedicated to making sure that those most at need have priority for the housing services that are available. Since 2017, DHS has developed predictive risk models that utilize administrative data to assign a risk score that is used to determine the appropriate course of action. Two of these models were developed to support prioritization of housing resources.

Allegheny Housing Assessment (AHA)

In 2020, DHS launched the Allegheny Housing Assessment (AHA), a decision support tool designed to help prioritize admissions to supportive housing services for individuals or families experiencing homelessness. The AHA forms the infrastructure for DHS’s coordinated entry system for those in a housing crisis.

The tool uses administrative data from Allegheny County’s data warehouse to predict the likelihood of three types of events occurring in a person’s life if they remain unhoused over the next 12 months: 1) a mental health inpatient stay, 2) a jail booking and 3) frequent use (4 or more visits) of hospital emergency rooms.  These events serve as indicators of harm if a person remains unhoused. The AHA assigns a risk score that is used as part of the housing prioritization process; it is far more objective and unbiased than earlier assessment tools and it doesn’t require the time or trauma associated with asking sensitive questions at the time of housing crisis.

Mental Health – Allegheny Housing Assessment (MH-AHA)

After a couple of years of experience with the AHA, DHS leadership realized that a similar tool could help prioritize admissions to residential services for individuals with a diagnosis of serious and persistent mental illness. Using the AHA as a starting point, the team developed the Mental Health – Allegheny Housing Assessment (MH-AHA) and launched it in February 2023.

Similar to the AHA, the MH-AHA utilizes administrative data from Allegheny County’s data warehouse to predict the likelihood of two potential types of adverse events that may occur in an individual’s life if they do not receive adequate support for their MH condition over the next 12 months: 1) a mental health inpatient stay and 2) frequent use [4 or more visits] of hospital emergency departments. These events serve as indicators of harm and are things we would like to prevent. The MH-AHA assigns a risk score that is used as part of the prioritization process. Individuals who are not eligible or who do not receive a risk score likely to lead to a placement in the near future will be introduced to other supportive services options instead of waiting a long time on a waiting list for a placement that might not occur.

By prioritizing those most in need of MH residential services, the MH-AHA will simplify the referral process, decrease uncertainty and reduce wait times. In addition, it will help Allegheny County document unmet MH residential needs created by the gap between limited MH residential resources and the number of high-risk eligible individuals. An external impact evaluation by researchers at Stanford will document progress toward these goals.

Select from the following documents to learn more about the AHA tool:

Select from the following documents to learn more about the MH-AHA:

Current Information

This dashboard shows trends in the number of people experiencing sheltered and unsheltered homelessness.

What is this dashboard about?

This dashboard displays: 1) the number of people who were active in an emergency shelter program per night dating back to January 2022, as well as basic demographic information on race, gender, and age; and 2) the number of people known to be experiencing unsheltered homelessness based on their engagement with street outreach teams dating back to September 2021. 

What data is available?

Emergency shelter data comes from the Homeless Management Information System (HMIS) and is updated daily. Unsheltered homeless data is updated weekly. Before September 1, 2024 the data came from a document used to facilitate coordination between local street outreach teams; data after September 1, 2024 comes from HMIS, as teams have standardized and expanded data entry in HMIS. 

Those active in local domestic violence emergency shelters are not represented in this dashboard, as domestic violence emergency shelters do not report usage in HMIS. These shelters have the capacity to serve approximately 100 clients per day.

Current information

The Allegheny County Department of Human Services’ (DHS) street outreach team works with people who are experiencing unsheltered homelessness, offering them immediate in-person support and help with basic needs, while also connecting them to emergency shelter, housing and critical services. Street outreach staff from DHS and partner organizations maintain a shared list of unsheltered individuals in Allegheny County with whom they are in contact, allowing staff to coordinate efforts and engage in basic case conferencing. This list represents those individuals who are working with a street outreach team and is not the entirety of people experiencing unsheltered homelessness in the County.

What is this report about?

This data brief focuses on a point-in-time cohort—156 individuals—who were on the street outreach list on a single day in October 2022. The brief characterizes that cohort in terms of demographics, veteran status, public benefit receipt, employment, and recent service and criminal justice involvement to inform programs and policies to better support these individuals.

What are the takeaways?

  • The most common age groups among these individuals were 25 through 34 (31%) and 35 through 44 (30%), followed by those 45 through 54 (22%). There were no children (under age 18) in this cohort (See Figure 2).
  • Sixty-five percent of this cohort were male and the majority (59%) were non-Hispanic White individuals, though People Of Color were overrepresented (See Figure 1, Table 1).
  • Among those with a recorded location (N=118), 48% (N=57) were staying in unsheltered locations in the North Side in October 2022. An additional 18% (N=21) were staying Downtown (central business district) and 18% (N=21) in South Side Flats (Figure 3).
  • In the most recent quarter for which we have employment data (April–June of 2022), fewer than 17% (N=25) of these individuals had any formal employment (defined as being in an Unemployment Insurance (UI)-covered job). Among this population, the most recent median quarterly earnings were just under $2,000 (See Figure 4, Figure 5).
  • Among those enrolled in Medicaid (N=129), 70% visited the emergency department in the last year (See Table 4).
  • Among those enrolled in Medicaid (N=129), almost half (43%) had accessed drug and alcohol services in the last year. Opioid use disorder and alcohol use disorder were the most common substance use diagnoses among those with a behavioral health claim in the last year (N=86) (See Table 4, Table 5).
  • Among those with a behavioral health claim in the last year (N=86), the most common mental health diagnoses were depressive disorder (N=20), adjustment disorder (N=16) and schizophrenia (N=16) (See Table 6).
  • In the last year, 62% (N=96) of the cohort had criminal justice system involvement. Thirty-eight percent (N=59) had a new criminal filing and 21% (N=32) were on community supervision with Allegheny County Adult Probation. Thirty-five percent of the cohort (N=55) were booked in the Allegheny County jail at some point during the last year (See Table 7).
  • Of the 38% (N=59) with a new criminal filing, the majority (56%, 33) only had low-level (misdemeanor) charges. Sixty-one percent (36) only had one criminal filing and the most common types of crime were property crimes (39%, 23) and drug crimes (34%, 20) (See Table 8).

How is this report being used?

The County is committed to better understanding the needs of its unsheltered population and identifying supports to help them transition to permanent stable housing. It is also committed to identifying programs and supports to help prevent people from experiencing unsheltered homelessness. This brief represents analysis to help support this planning process.

Current Dashboard

What is this dashboard about?

These interactive dashboards contain information about Landlord/Tenant cases filed in Allegheny County in magisterial district courts from 2012 to the present. Users can see information about the number of cases filed over time, what happens to those cases as they proceed through the courts, how long it takes for cases to proceed through the courts, costs and case outcomes. The data do not record whether an eviction took place (e.g., tenant moved, tenant was ejected) at the end of the case.  The data used for these dashboards are updated daily.

How is this dashboard being used?

With the lifting of the eviction moratorium and phasing out of the emergency rental assistance program, landlord/tenant filings have increased back to pre-COVID levels.  The county is using this information to help target investments that help mediate these conflicts in the hopes of reducing the number of people who ultimately get evicted.