
Across the U.S., cities are facing increasing numbers of people experiencing homelessness. Meanwhile, an inadequate supply of deeply affordable housing has made it nearly impossible for individuals and families to move out of the shelter system.
Allegheny County’s 500 in 500 initiative responded to this needs gap with urgency, coordination, flexibility and creative problem-solving. County and City government, housing authorities, nonprofit organizations, foundations, developers and advocacy groups came together to make existing units or building conversions available for people living in shelters. The initiative moved hundreds of people from shelter to permanent housing, freed up shelter space for individuals and families in crisis and reduced strain across the homelessness response system.
Read the report below to learn how the initiative took shape, hear perspectives from those closest to the work and explore results as of day 500.
A Dramatic Change, In 500 Days
Sometimes, if circumstances create a sufficient sense of urgency, leaders can find creative ways to solve what seemed to be a chronic problem. That’s what happened when leaders in Allegheny County came together to design a bold initiative to increase the availability of deeply affordable housing for people experiencing homelessness. The resulting initiative has moved hundreds of people from shelter to permanent housing, freeing up emergency shelter space for individuals and families in crisis.
Across the U.S., cities have been dealing with the growing number of people experiencing homelessness. Meanwhile, an inadequate supply of affordable housing made it impossible for individuals and families to move out of the shelter system. The result? Shelters, meant to be a short-term solution to a crisis situation, were serving as longer-term housing for people who were ready to live more independently in permanent affordable housing, while those in need of temporary emergency shelter were forced to wait—on the streets, in parks, in doorways or in temporary encampments. The visibility of these encampments and other issues related to people having no place to go led to a loud and persistent public outcry and call for solutions.
In response, County and City government, housing authorities, nonprofit organizations, foundations, developers and advocacy groups came together to rethink how to help people move from shelters and the streets to permanent residences.
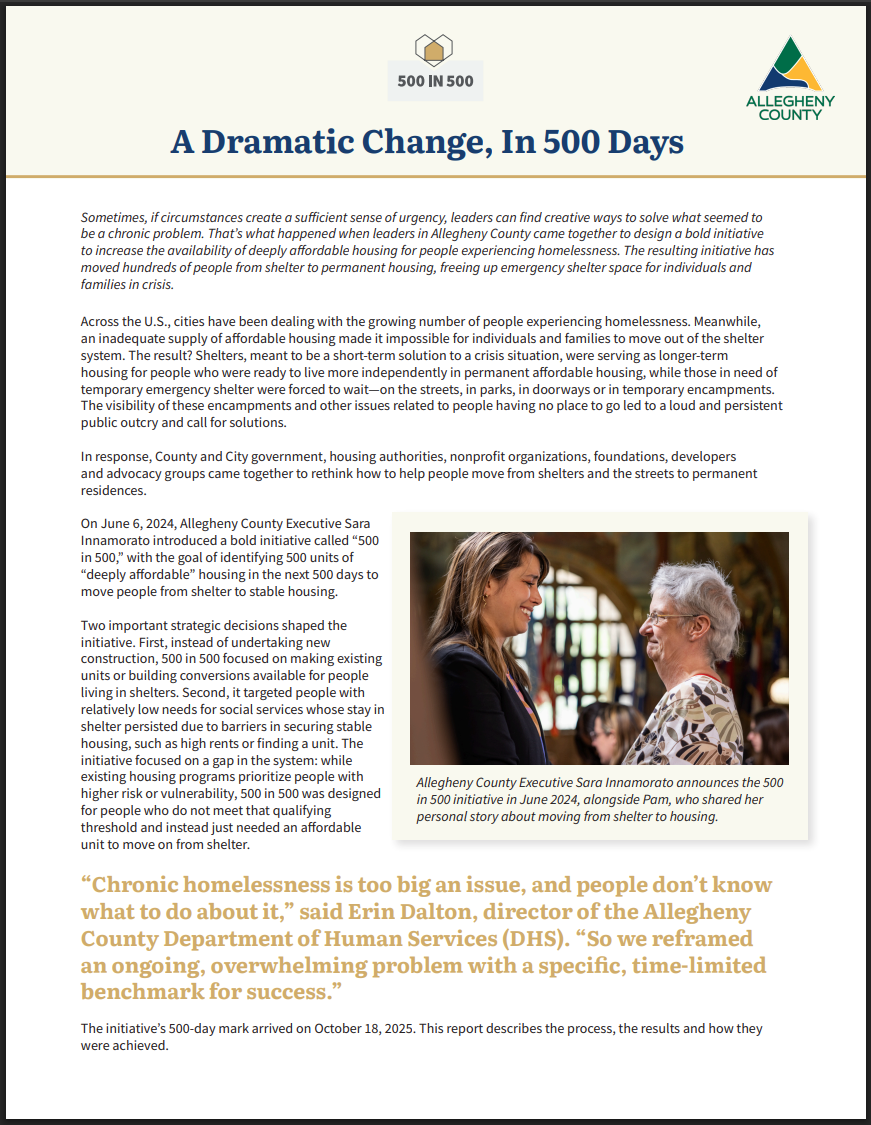
On June 6, 2024, Allegheny County Executive Sara Innamorato introduced a bold initiative called “500 in 500,” with the goal of identifying 500 units of “deeply affordable” housing in the next 500 days to move people from shelter to stable housing.

Two important strategic decisions shaped the initiative. First, instead of undertaking new construction, 500 in 500 focused on making existing units or building conversions available for people living in shelters. Second, it targeted people with relatively low needs for social services whose stay in shelter persisted due to barriers in securing stable housing, such as high rents or finding a unit. The initiative focused on a gap in the system: while existing housing programs prioritize people with higher risk or vulnerability, 500 in 500 was designed for people who do not meet that qualifying threshold and instead just needed an affordable unit to move on from shelter.
“Chronic homelessness is too big an issue, and people don’t know what to do about it,” said Erin Dalton, director of the Allegheny County Department of Human Services (DHS). “So we reframed an ongoing, overwhelming problem with a specific, time-limited benchmark for success.”
The initiative’s 500-day mark arrived on October 18, 2025. This report describes the process, the results and how they were achieved.
Formulating a strategy
Affordable housing was a high priority for Innamorato—and an issue she understood well. Having experienced housing instability as a teen, Innamorato prioritized housing policy issues long before becoming County Executive. She served on the board of the Allegheny County Housing Authority (ACHA), and as a State Representative introduced the landmark Whole Home Repairs Act in the state legislature. When elected to lead Allegheny County, Innamorato made it clear that affordable, accessible housing for everyone in Allegheny County was one of her signature priorities.
For Dalton, who managed DHS’s analytics work before becoming its director, everything starts with data. The most obvious data in this case were rising numbers of people on the streets and longer stays in shelters. But along with increasing need, Dalton also saw hopeful data on the supply side, in the form of the thousands of empty apartment units and subsidized housing vouchers available through the City and County housing authorities.

Public housing and voucher subsidies are in heavy demand, but Rich Stephenson, executive director of ACHA, knew one way to reduce the bottleneck. Since the moratorium on evictions during the COVID-19 pandemic ended, ACHA’s inventory of unoccupied units had grown because previous tenants, who had since been evicted, had left behind units that were uninhabitable.
“We had a substantial number of units with $5,000 to $15,000 of damage, mostly from families who had been living there for a long time and not paying rent,” Stephenson explained. “Because of our limited resources, we could not repair these units. Now, DHS needed these family units.”
Local developers also came to the table to dedicate units specifically for people coming from shelter. “The County Executive set a clear expectation that this was not business as usual,” explained Ed Nusser, Director of Housing Strategy for Allegheny County. “We leveraged the resources we had, telling developers that if they’re getting County support, we now expect some of their units to be available for people to move out of shelter. And the developers stepped up to be part of the solution.”
“The County Executive brought her political will and expertise to bear and coordinated many public- and private-sector players to align around solving this problem,” said Kendall Pelling, executive director of Rising Tide, a community organization with a focus on preserving affordable housing. “We have many projects that would not be happening today without 500 in 500.”
As the vision for 500 in 500 emerged, Allegheny County approached local foundation partners for help. Five area foundations stepped forward with a combined $3.4 million of assistance. While 500 in 500 didn’t have a budget, per se—part of the special sauce was that its success was mostly based on process improvements that didn’t cost money—this private support funded key parts of the initiative, including the rehabilitation of the housing authorities’ vacant rental units and supportive and case management services to assist housing recipients.
“Grantmaking is about investing in people you trust,” said Lauri Fink, senior program officer at Henry L. Hillman Foundation. “We have trust in the County Executive, Erin and County staff to find the best way forward.”
DHS expanded its own complement of staff helping people move from shelters to permanent housing and provided funding that enabled ACHA to hire six staff to provide supportive services to tenants. In addition, the authority used Urban Redevelopment Authority funds to purchase a 19-unit building on Pittsburgh’s North Side. The Housing Authority of the City of Pittsburgh (HACP) made project-based vouchers (which are attached to the unit, not the resident) available for 500 in 500 tenants moving into ACHA’s North Side location and other private developments.

HACP’s main procedural change involved setting aside both project-based and tenant-based vouchers for the 500 in 500 population. “What made this successful was that our staff interacted directly with the DHS caseworkers rather than the unhoused clients,” said Sauntee Turner, HACP government relations liaison. “They could collect all the needed documents for the application, so we just had to do background checks for eligibility. We got the process down from the usual 30 or 40 days to 11 days.”
The housing authorities also made vouchers portable across municipal lines—which was important, so that people could find an apartment in a neighborhood that worked for them.
Expediting the flow
Chuck Keenan, an administrator in DHS’s Office of Community Services, saw firsthand the challenges shelter staff faced in helping clients move into permanent housing. Before the 500 in 500 initiative, an effort known as the Second Avenue Commons pilot revealed that shelter staff did not have a clear understanding of eligibility for Continuum of Care (CoC) programs or access to resources that identified viable alternative housing pathways.
DHS addressed these system gaps by sharing information and developing resources to build shared understanding, clarify housing pathways and strengthen alignment across partners. This positioned the County to take on the 500 in 500 initiative from a place of readiness.
With those earlier challenges addressed—and with more public housing units and vouchers coming online—the 500 in 500 goal began to sound achievable. However, success depended on the system’s ability to move people quickly and on whether housing units could remain available long enough to make a match.
Private landlords willing to rent to a 500 in 500 participant could not hold units open indefinitely. To balance timely placements with landlord needs, DHS asked landlords and ACHA to commit to holding a unit for 500 in 500 clients for up to 14 days. “We don’t want our clients to get demoralized by looking at a unit and then finding out it’s been taken,” Keenan explained. “If we can’t match anyone to the unit in two weeks, then they can offer it elsewhere.”
Landlords welcomed the arrangement because it often brought paying tenants quickly. But meeting the 14-day window required case managers to act quickly. When the initiative began, case managers had to physically scan spreadsheets to match potential occupants to units that met their eligibility and preferences.
To address this issue, DHS’s Chief Technology Officer Rachel Silver streamlined the process by constructing a detailed dashboard where participating landlords enter pertinent information about their unit, including location, number of bedrooms, any age requirement, access to public transit, what utilities are included, whether pets or smoking are permitted, and if they will accept tenants with a prior history of felonies or evictions. The dashboard already contains a master list of all public housing properties, so the housing authorities can simply check a box when a particular unit becomes open.
Thanks to this dashboard, case managers can go online, enter a client’s characteristics, and see all the available units that fit the search criteria. Or they can select an open unit, see all the prospective tenants whose criteria match it, and reserve it directly through the platform.
Brent Weinert, who helps individuals prepare for a housing placement, deeply appreciates the changes. “Doing subsidized housing applications takes a lot of paperwork,” he noted. Before 500 in 500, “you might do 20 applications in the hope that one might work.” Now, the dashboard and ACHA’s preference designation for people who have nowhere to live create a high percentage of success. Weinert said that in many cases, clients have been able to move from intake to a housing offer within 30 days.
Weinert’s team has grown to seven caseworkers who conduct housing assessments and develop permanent housing plans for clients who do not qualify for higher levels of supportive housing services.
One frequent obstacle to housing eligibility is that many applicants lack the documentation—birth certificate, social security card and ID card—that public housing authorities require. To resolve that bottleneck, DHS senior advisor Kathy McCauley recruited a team of eight part-time staff, including some DHS retirees with prior case management experience, who have so far helped 700 individuals assemble their documentation so that they are housing-ready. Because new shelter residents continually arrive, this project remains in place.
While Weinert works with single individuals, Remy Harris supervises a team assisting families. Although most families exit from shelter within six months, Harris has seen some stay for much longer—especially those facing housing barriers such as prior evictions, a criminal record, or owing money to a housing authority.
Along with the streamlined matching and application process, Harris credits the stronger relationship between DHS and the housing authorities, which includes weekly coordination meetings, with making her work easier.
“They know they can count on us, so they are more willing to take people coming from the shelter system in their units,” Harris said.
Support from 500 in 500 does not end when an individual or family moves into a home. A tenant support program, created two years ago, embraced the task of reaching out to 300 households during 2025; by October, they had already served 290. Program coordinators work with clients to develop a support plan that addresses tangible needs such as food, transportation, furniture and employment assistance. “I believe the most significant impact our team has made on our clients is not just resource linkage but providing support and reassurance that the client has the ability to maintain housing and to further pursue a life of stability and self-sufficiency,” said James Greer, tenant support program administrator.
Treating people in tents with dignity
Few people support tent cities in downtown areas, but just as few support callous emptying of encampments where unhoused people have placed their scant possessions. 500 in 500 offered a different approach to this vexing problem.
Muhammad Ali Nasir (better known as Man-E) played a key role. Man-E founded an outreach program for current and former jail residents that expanded into homeless outreach in 2022 and later became part of 1Hood Media. In this role, he met with City and County leaders, insisting that before they cleaned out any encampments, they needed to give residents a viable place to go.
Man-E had been involved from start to finish with a 40-tent encampment that popped up along the Eliza Furnace Trail near downtown. “I gave the first tent to someone living there,” he said. “They’d been kicked out of a shelter. If they were going to shut down the encampment, we wanted it to happen in a dignified way.”
That’s exactly what happened in fall 2024, when the County, City, outreach workers and advocates worked together to move people inside. Man-E and other outreach workers compiled a list of the encampment residents, their living situation (i.e., whether they had a partner, a pet, or other needs) and what housing they would accept. As a placement was identified for each, Man-E helped transport their belongings to the new location. Only then was the tent marked as vacant and ready for removal.
Contrary to popular assumptions, Man-E said the majority of encampment residents were there for financial reasons, not due to mental health or substance use issues. Some had been released from jail with no local family or social support. All were happy to move into housing options that worked for them, including scattered site shelters, bridge programs and permanent housing.
“I did not always trust DHS or City government before this project,” Man-E acknowledged. “Now that I have worked closely with them to eradicate homelessness, I have seen the fruits of their labor.”
Lisa Frank, former chief operating and administrative officer for the City of Pittsburgh, highlighted the impact of 500 in 500 in enabling city government to offer a credible alternative to living unsheltered.
“People can come into a shelter through the front door, but they have to have a back door so that they can leave shelter and be properly housed,” Frank stated. “A congregate shelter with minimal privacy is not how people want to live. A lot of people won’t want to come in from the cold if they think they will end up on the top bunk in a room of 30 people for the next 365 days. With the focus on housing, we create flow in our system. Now, if someone puts up a tent, outreach workers can go out and tell them that this is not a safe place to live but that we can help them find one.
“Unhoused people can see, just like everyone else, what’s working or not working,” Frank added. “When they learn that their friends are finding credible alternatives to living alongside a trail, that changes the conversation. 500 in 500 has made it possible for us to say to people living outside, ‘Come to our shelter and we can work from there.'”
Results as of Day 500
Quantitatively, there’s no question that 500 in 500 has been a success. As of day 500 (October 18, 2025):
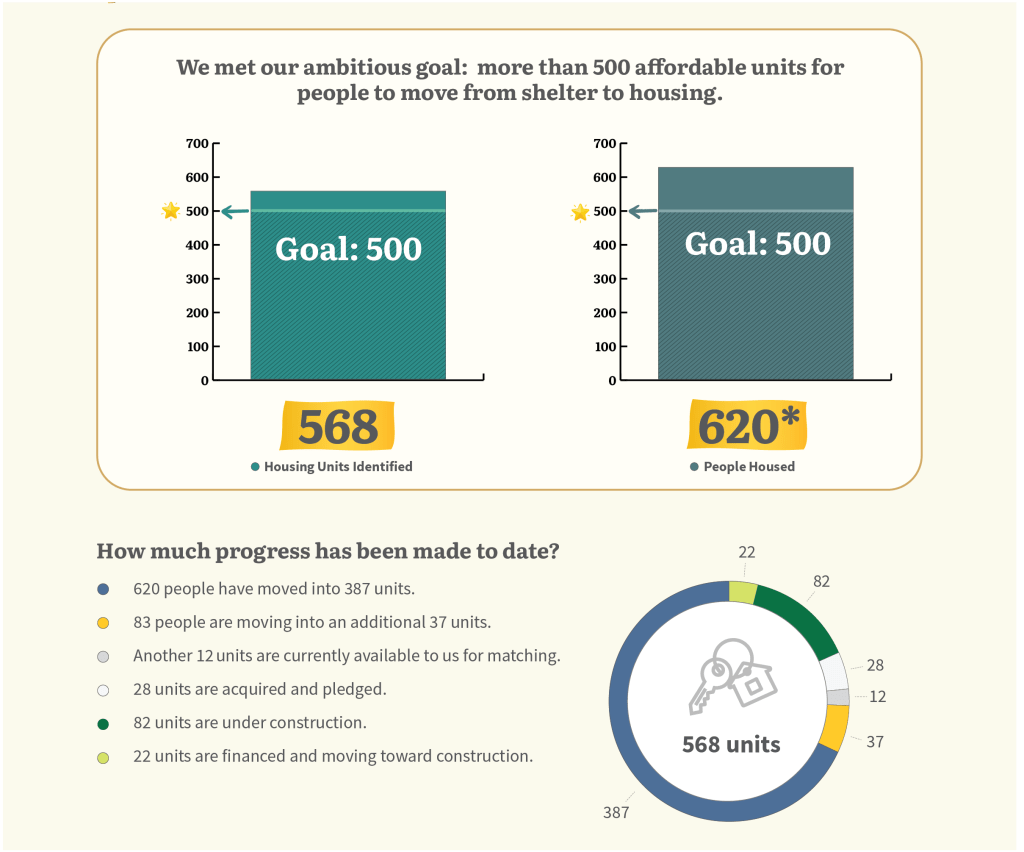
- Forty-nine percent (273) of the units were in the private market, forty-one percent (228) were from a housing authority and the remaining 9% (52) were supportive housing.
- Two hundred forty-four adults, including many who are 55+, and 102 families with children have secured housing. Most families with children had
a household size of two to four people, but the initiative has found housing for families with as many as eight members. - Among single adults, the average number of exits to rental units increased 35%, from about 20 per month in the year preceding the initiative to an average of 27 per month during the initiative.
- As of early November 2025, 98% of families with children and 95% of adults who leased a unit through 500 in 500 had not returned to the homelessness system.
- The total number of tents along the riverfront trails and in downtown Pittsburgh reached a high of 143 on August 20, 2024; that number stood at two as of the end of October.

When the County set out to quickly house individuals staying in shelter who were assessed as relatively low-risk, they relied on a predictive risk model—the same model used to identify those eligible for permanent supportive housing. Allegheny County DHS is one of only a few governments in the world using predictive analytics to target interventions. Most systems still depend on manual, time-consuming assessment tools that are less accurate and often reinforce bias. Those approaches result in the less precise identification of target populations, thus diluting the impact of interventions. In contrast, DHS’s models have repeatedly proven to be more accurate than traditional methods and to reduce racial disparities in outcomes. This data-driven precision is a key reason for the success of 500 in 500.
Among over 400 people who leased through 500 in 500 through June 2025:
- Only 6% subsequently experienced a mental health crisis
- A remarkably low 1% had a mental health inpatient stay
- Only 4% had more than four emergency department visits (compared with over 40% for their high-risk peers staying in shelter)
- Only 1% had a booking in the County Jail
Qualitatively, participants and stakeholders have expressed appreciation for the quality and efficiency of service; the fruitful collaboration between DHS and the City and County housing authorities; the inclusion of a broad range of stakeholders concerned about the attractiveness of downtown Pittsburgh; and the innovation and decency with which Pittsburgh and Allegheny County have tackled the vexing problems of homelessness and tent encampments.
“It was a privilege to be invited to the 500 in 500 table early on,” said Matt Galluzzo, president and CEO of Riverlife. “Erin Dalton and DHS have done a brilliant job of using data to understand the problem better, advance solutions, and set an audacious goal to get the system working as it should. I commend the City and County for approaching this problem in an appropriate and dignified way. This is a great example of Pittsburghers understanding our community and rallying to support those in need.”
“It is exciting to see so many City and County departments come together to work toward the same end goal,” said Fink of Henry L. Hillman Foundation.
“500 in 500 has succeeded in getting everyone focused on moving people into housing.”
Chuck Rohrer, HACP communications director, echoed Fink’s sentiments: “The interagency cooperation is much better than before. It’s nice to see that Pittsburgh can pull together and achieve such an ambitious goal.”
“I could never have imagined a government office operating with this speed and agility, especially while relying on in-house expertise,” said Silver, the DHS technology officer. “Peers at other levels of government are often surprised by how quickly we can move and how much we do in-house.”
For ACHA’s Stephenson, the chance to deploy his agency’s resources with greater effectiveness has been rejuvenating. “This partnership is not going to end on the 500th day,” he declared. “It will absolutely continue as long as I am sitting here.”
County Executive Innamorato said, “I’m thrilled with the success of 500 in 500. Not only did we exceed our goals in terms of identifying units and housing people, we forged new partnerships and changed systems that will continue to provide lasting benefits well past day 500.”
Thank You to Our Partners
Government Partners
- Allegheny County Department of Human Services
- Allegheny County Economic Development
- Allegheny County Housing Authority / Glenshaw Gardens
- City of Pittsburgh
- Housing Authority of the City of Pittsburgh
- PA Housing Finance Agency
- Urban Redevelopment Authority of Pittsburgh
Property Owners
- Action Housing
- Baltic Steel Management
- Brandywine Communities
- Clairton Community Properties
- Hullett Properties
- MS Capital Group Pittsburgh LLC
- NDC Asset Management
- Rising Tide Partners
- Trek Development
Foundations
- Buhl Foundation
- Eden Hall Foundation
- The Heinz Endowments
- Henry L. Hillman Foundation
- Richard King Mellon Foundation
Questions or Feedback?
We welcome your questions and suggestions. To share feedback, you can reach us at DHSResearch@alleghenycounty.us. If you’d like to stay informed, consider signing up for our newsletter. To learn how to use DHS data in your research, please visit our Requesting Data page. Thank you for your time and interest. Your engagement helps shape and improve how we share data that matters.