The Allegheny County Department of Human Services (DHS) partnered with Pittsburgh Regional Transit (PRT) to launch a transportation assistance program called Allegheny Go. This program offers half-price PRT rides for county residents ages 12 to 64 who receive Supplemental Nutrition Assistance Program (SNAP) benefits, and do not receive any other transit fare discounts. 

Allegheny Go builds on the success of the Allegheny County Discounted Fares Pilot Program, which ran from November 2022 through June 2024.  

This dashboard describes the application process and reports on application statistics and participant demographics.  

DHS has set a goal of enrolling 15,000 participants in Allegheny Go. This dashboard tracks progress towards that goal. Staff monitor how many applications are received, how many are eligible, and make sure eligible participants receive their discounts.  

Allegheny County Department of Human Services developed these dashboards to provide information to the community about violence trends in Allegheny County and the City of Pittsburgh.

What is this dashboard about?

The dashboard contains information about all homicides in the county and city (as reported by the county’s medical examiner) and contains a link to the Pittsburgh Bureau of Police’s dashboard showing shootings within the City of Pittsburgh. The dashboard shows trends in homicides, including trends in demographic data for victims and trends in homicide locations. The dashboard also shows information on human service, physical and behavioral health, income supports and justice involvement for the victims prior to their death.

What data is available?

Data on homicides is available through the Allegheny County Medical Examiner’s office. It is available from 2007-present and is updated monthly. Data on program involvement (including prior justice involvement) comes from Allegheny County’s data warehouse, which integrates information from more than 20 distinct sources. Read more about the county’s data warehouse here.

Current dataset and related materials

What is the Community Need Index?

The Allegheny County Department of Human Services (DHS) conducts a Community Need Index (CNI) to identify specific areas that are in greater need, and face larger socioeconomic barriers, relative to others. The newest version of the CNI index ranks neighborhoods by need level by looking at:

  • The percentage of families who live below the poverty line
  • The percentage of unemployed or unattached males
  • The percentage of those aged 25 and up without at least a Bachelor’s degree
  • The percentage of single parent households
  • The percentage of households without internet access
  • Rate of homicide per 100,000 residents
  • Rate of fatal overdoses per 100,000 residents

The researchers used a census tract level to break up the region and assess needs. Census tracts are static, relatively small subdivisions of a county.

How can I view the findings?

An interactive map allows users to view and extract data from the 2024 CNI (which uses 2022 five-year data estimates and totals). The new report focuses on all of Allegheny County, examines changes in need over time, and places emphasis on the connection between race and community need. Earlier reports are linked below.

What are the takeaways?

  • In Allegheny County, we continue to find the highest levels of need in specific sections of the City of Pittsburgh (Hill District, South Hilltop, parts of the West End, Upper East End neighborhoods, Upper Northside) as well as census tracts outside the City of Pittsburgh (Mon Valley, sections of the Allegheny County River Valley, sections of Penn Hills, sections of Wilkinsburg, Stowe-Rocks).
  • There are vast discrepancies between the lowest need communities, which have an average poverty rate of 2%, and the highest need communities, where the average poverty rate is 38%.
  • With few exceptions, census tract-level community need is persistent over time.
  • Only about one-third of Allegheny County’s Black residents live in lower-need communities. For every other racial and ethnic group in the County, the majority of residents live in lower need communities. Black communities in Allegheny County have disproportionately high levels of need, as do a number of racially mixed communities. 
  • Poverty status alone does not account for where various racial and ethnic groups tend to live by level of need; poor Black and Latino families are more likely than other poor families to live in higher need communities. Even Black families above the poverty line are many times more likely than their Asian, White and Latino peers above the poverty line to live in higher need communities.

How is this report used?

The geographic dimensions of community need can help inform many aspects of DHS’s strategic planning and resource allocation decisions, such as decisions on where to locate Family Centers or new after-school programs.

Where can I go for more information?

For more information, you can read previous reports below. Or you can reach out to DHS-Research@alleghenycounty.us with any questions.


Previous reports in this series 

Previous datasets in this series

Current Information

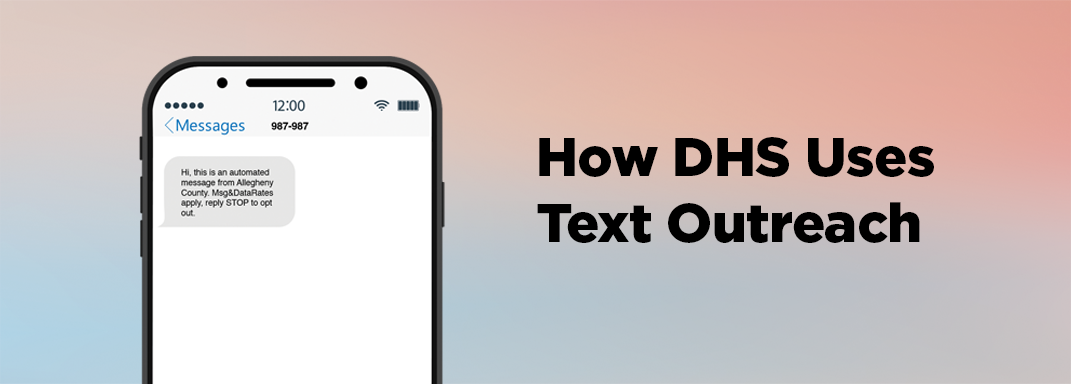
Allegheny County DHS sends text messages to county residents for a variety of reasons, including increasing awareness of services, providing timely reminders, and gathering feedback after a service experience.  In addition, DHS uses this information to help evaluate and monitor programs it delivers.  This dashboard displays information about these outreach and engagement efforts, including the subject and purpose of these and the rates of engagement.  Data on DHS’s texting efforts are available from November 2017 to the present.

The dashboard allows users to examine DHS text messaging as a whole as well as drill down to individual text campaigns.  It allows users to understand the purpose of each campaign, the number of messages sent and the demographics of the people being contacted by each campaign.  DHS collects this information through Community Connect Labs (CCL), DHS’s texting software, and information is updated daily. Click here for a more detailed report on DHS’s texting outreach from 2018-2022.

Current Information

This dashboard shows trends in the number of people experiencing sheltered and unsheltered homelessness.

What is this dashboard about?

This dashboard displays: 1) the number of people who were active in an emergency shelter program per night dating back to January 2022, as well as basic demographic information on race, gender, and age; and 2) the number of people known to be experiencing unsheltered homelessness based on their engagement with street outreach teams dating back to September 2021. 

What data is available?

Emergency shelter data comes from the Homeless Management Information System (HMIS) and is updated daily. Unsheltered homelessness data comes from a document used to facilitate coordination between local street outreach teams and is updated weekly

Those active in local domestic violence emergency shelters are not represented in this dashboard, as domestic violence emergency shelters do not report usage in HMIS. These shelters have the capacity to serve approximately 100 clients per day.

Current information

What is this dashboard about?

This dashboard displays information about the SeniorLine, a resource where individuals can receive information about services and programs for older adults in Allegheny County. SeniorLine care managers typically discuss:

  • Senior center activities
  • Care management
  • Support for caregivers
  • In-home services
  • Transportation assistance
  • Assistance with medication management
  • Utility assistance 
  • Property tax and rent rebate assistance

SeniorLine Care Managers are available Monday through Friday from 8:30 am to 4:30 pm at 412-350-5460.

What data is available?

The dashboard includes detailed information about SeniorLine interactions and communications, including call times, context, outcomes, and users. Typical callers are individuals 60 years of age or older, their families and caregivers, and other sources of support. Most individuals live within Allegheny County but there are some calls concerning people living outside of the county.

The dashboard is updated at the end of every month.

Current Dashboard

What is this dashboard about?

These interactive dashboards contain information about Landlord/Tenant cases filed in Allegheny County in magisterial district courts from 2012 to the present. Users can see information about the number of cases filed over time, what happens to those cases as they proceed through the courts, how long it takes for cases to proceed through the courts, costs and case outcomes. The data do not record whether an eviction took place (e.g., tenant moved, tenant was ejected) at the end of the case.  The data used for these dashboards are updated daily.

How is this dashboard being used?

With the lifting of the eviction moratorium and phasing out of the emergency rental assistance program, landlord/tenant filings have increased back to pre-COVID levels.  The county is using this information to help target investments that help mediate these conflicts in the hopes of reducing the number of people who ultimately get evicted. 

Current Documents

What are Child Fatalities and Near-Fatalities?

The County is required by state law to review each death or near-death of a child and use the information to improve practice and systems. The 2008 Act 33 Amendment to the Child Protective Services law requires state and local reviews of all child fatalities and near-fatalities that result from suspected child abuse.

What can the dashboard tell us?

This dashboard and series of reports describes findings and outcomes from child fatality/near-fatality (CFNF) reviews. Information about the incidents–including victim and perpetrator demographics, cause of death/injury and families’ prior involvement with the child welfare system–is available in these reports as well as case practice and system reforms enacted to reduce the likelihood of future child abuse-related incidents.

Trouble viewing the dashboard below? You can view it directly here.

How is this information being used?

In addition to the state required reporting of child fatalities and near-fatalities, DHS has used the information to make recommendations to prevent these tragedies in the future. These recommendations include:

  • Improved collaboration with medical physicians
  • Upstream prevention and intervention services
  • Integration of the child welfare system and the substance use treatment system
  • Community and firearm violence reduction
  • Applying safety science to child protection

In depth explanations of these recommendations can be found in the “current documents” section above.


Previous reports

Current dashboard and report

What are Older Adult Protective Services?

This program provides services to vulnerable adults who are at risk of abuse, neglect or exploitation. Through a telephone hotline, residents can report allegations of harm to an older adult. Staff collect information about the allegation, investigate the situation, and, if allegations are substantiated, work with the individual on a care plan.

What data is available?

A related analytics report describes our findings. The dashboard below provides an overview of how allegations are made, investigated, and substantiated. It also provides information on:

  • Number of calls to the protective services hotline
  • How many allegations were investigated
  • How many investigations were substantiated
  • Demographics of alleged victims

The dashboard is updated yearly, when new data is available.

Trouble viewing the dashboard? You can view it directly here.

The Emergency Rental Assistance Program offers financial assistance for people struggling to pay rent or utilities due to COVID-19. These dashboards track data about the program, those who have applied, and those who have received funds.

Trouble viewing the dashboard? You can view it directly here.

Current report and dashboard

What information about overdose deaths is available?

  • A report describes accidental overdose deaths that occurred in Allegheny County from January 2016 through June 2020 with a look at trends in numbers of deaths, demographics, and substances involved, like opioids and fentanyl.
  • An interactive dashboard provides data from 2008 and allows users to filter data for a closer look at particular years, substance types, demographic groups, and neighborhoods. The dashboard also provides information about fatal and non-fatal overdoses that resulted in hospital emergency department visits or administration of naloxone by EMS.

The report and dashboard are joint efforts of the Allegheny County Department of Human Services (DHS) and the Allegheny County Health Department (ACHD), present an analysis of deaths resulting from opioid overdose.

How is this data used?

Data on victims and potential risk factors can help County government and other stakeholders implement evidence-based strategies to address the ongoing opioid epidemic. The reports, maps and dataset are provided in an effort to inform and stimulate discussion about substance use treatment and prevention.


Related materials

Previous reports about accidental overdose

Dataset

  • Overdose deaths by Allegheny County municipality: 2008-2014

Maps


The dashboard below provides information about Allegheny County Jail population management, including the daily jail population, population in alternative housing, bookings and releases, and lengths of stay. Data is available from 2018 to the present and is updated daily.

Trouble viewing the dashboard? You can view it directly here.

Access the dashboard

The dashboard below provides an overview of Allegheny County child welfare out-of-home placements from 2010 through 2021. Data describe yearly point-in-time counts of children in placement (“PIT” tab), characteristics of children in placement, what types of placements were used, how long children stayed there, where they went after their placement ended (also known as exits) and how many returned to the child welfare system after returning home (also known as re-entries). The dashboard is updated annually when a full year of data becomes available.

A related report provides analysis of placement trends over the past decade.

Trouble viewing the dashboard? You can view it directly here.


Related materials

Access the dashboard

The dashboard below provides information about the change in Allegheny County residents’ use of human services and other public services. Data includes homeless shelter usage, calls to child welfare and calls to the SeniorLine.  The dashboard also includes key performance indicators in the county’s criminal justice system.


Trouble viewing the dashboard? You can view it directly here.


Access the dashboard

The dashboard below displays information about Allegheny County suicides since 2002. View trends in yearly suicides, demographics of people who died by suicide, and locations within the county. The data is updated monthly.

A related data brief is also available.

Problems viewing the dashboard? You can view it directly here.


Related materials